Downscaled Climate Projections
Statistical Models
Precipitation - Basics
In contrast to maximum and minimum temperature, the distribution of precipitation is strongly non-normal. The most obvious departure from normality is the sharp lower bound on precipitation amount--you can't have negative precipitation! But precipitation strongly departs from normality in other ways, too. For example, at Madison, WI approximately 67% of days have exactly the same value for precipitation, namely zero. Moreover, when precipitation does occur the most likely precipitation amount is the smallest measureable value, yet precipitation distribution also has a long tail consisting of rare but very large amounts (Figure 1).
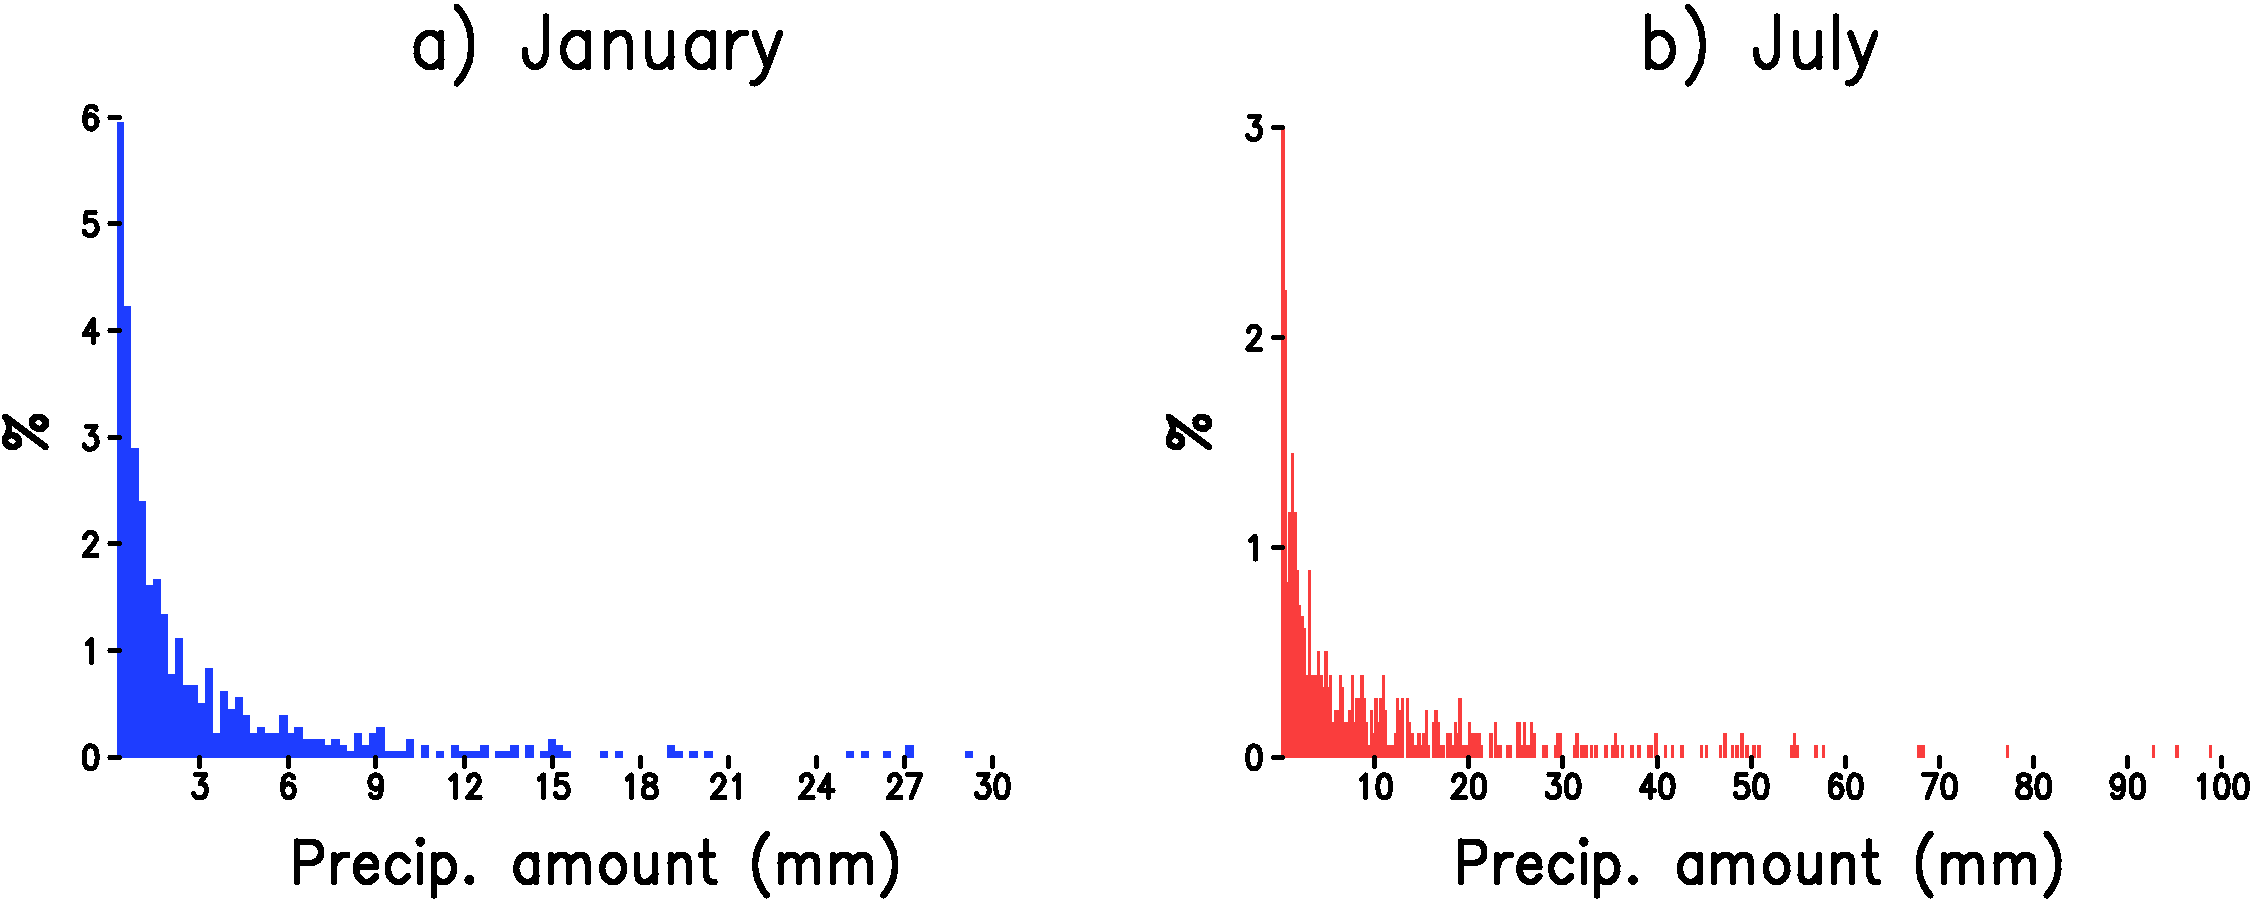
Figure 1: Histogram of daily precipitation accumulation at Madison, WI for wet days only. a) January. b) July. The y-axis is the number of days in each bin divided by the total number of days (%) and the x-axis is the precipitation amount at the bin center in mm. The bin width is 0.254 mm.
To model the relationship between large-scale variables and the precipitation at a point, we follow the methodology commonly used in the "weather generator" literature where the simulation of precipitation is divided into two separate models. One model predicts whether the day is wet or dry (precipitation occurrence model) and another model predicts the amount of precipitation if the day is wet (precipitation amount model).
Home