Light Pollution Atlas
View Atlas in OpenStreetMap
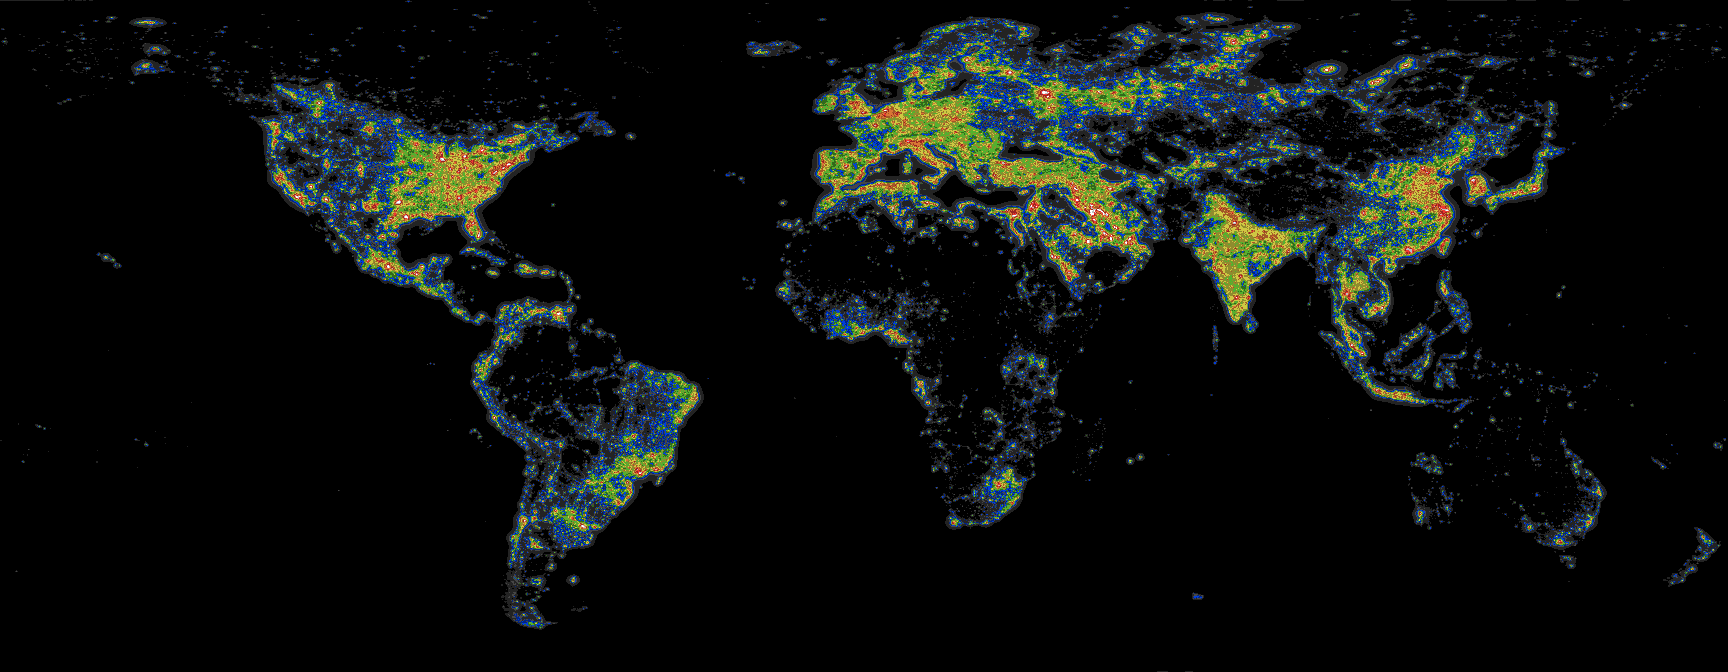
Welcome to the latest version of the World Atlas of the Artificial Night Sky Brightness! I’ve re-calculated Pierantonio Cinzano’s original atlas using more recent satellite data from 2024. The light pollution atlas is not based on direct measurements. Instead it is estimated using a model of atmospheric light transfer, extinction and scattering. The model calculates the amount of artificial light that is scattered back downward due to air molecules and aerosols. As input, the model requires a global dataset of the artificial (human-caused), ground-based light sources. The light source data comes from annual average cloud-free nighttime lights processed and produced by the Earth Observation Group at the Colorado School of Mines, which is typically updated annually. The raw light data comes from NOAA’s VIIRS satellite.
The meaning of the atlas colors is given here. Most light pollution websites, including ones that have simply copied my data, state that the maps depict the Bortle Scale. This is not the case. The light pollution maps are a simulation of the artificial brightness at zenith (straight up). The Bortle scale is a subjective metric (gauged using your eyes) which takes into account the entire sky from horizon to zenith. If you use may maps on your site, I ask that you do not conflate the Bortle Scale with my maps. The discrepancies between brightness at zenith and the Bortle scale are discussed here.
The Maps:
The full resolution world map is very hard to view due to its size. Therefore I also have a medium resolution world map and full resolution continent-scale maps that may be easier to use. A map showing the domain of the 6 continent-scale maps is below. There are two versions of each map: one with borders and coastlines and the other with nothing except light pollution. The resolution of most maps is 1/120 degrees. The medium resolution world maps are 1/40 degrees. I’ve used an "expanded color scale" for all maps.
No Coastlines or Borders |
White Coastlines and Borders |
Domain (degrees) |
|---|---|---|
65S to 75N, 180W to 180E |
||
7N to 75N, 180W to 51W |
||
57S to 14N, 93W to 33W |
||
34N to 75N, 32W to 70E |
||
36S to 38N, 26W to 64E |
||
5N to 75N, 60E to 180E |
||
48S to 8N, 94E to 180E |
||
65S to 75N, 180W to 180E |

For more information contact:
David Lorenz
dlorenz@wisc.edu